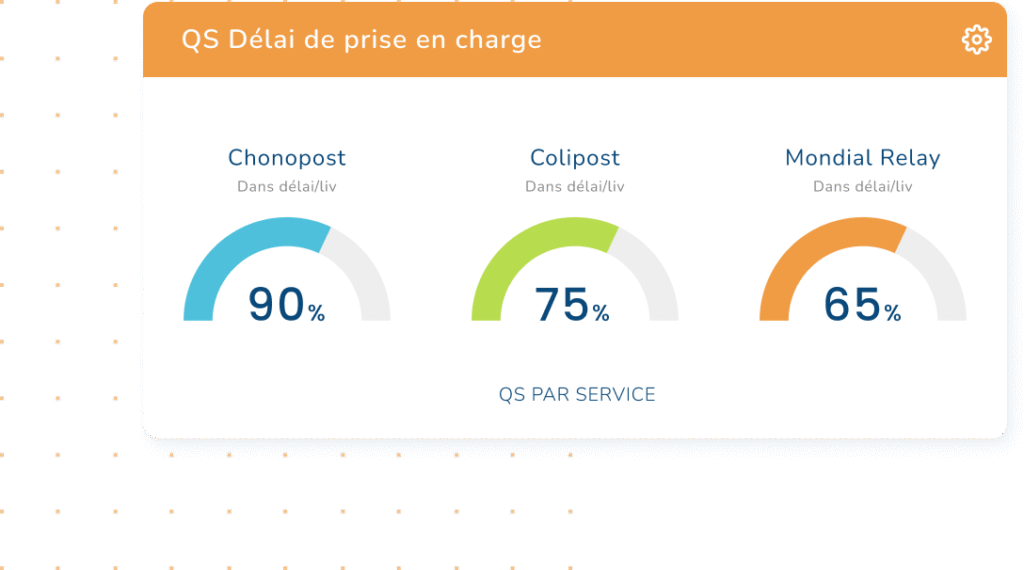
A centralized view of your key logistics quality indicators
Take control of your operations with complete centralization
In an environment where logistics data is pouring in from multiple sources, centralized information is more than essential for e-tailers. WelcomeTrack offers you a comprehensive, customizable dashboard, designed to give you a clear, usable overview of your key performance indicators (KPIs). Transform your data into powerful decision-making tools to optimize your post-purchase operations.
Why centralize your indicators is essential
Logistics operations rely on smooth data management, but dispersed information can lead to :
- Decisions delayed by lack of visibility.
- Costly errors due to misinterpretation of data.
- Time wasted consolidating information from different platforms.
With WelcomeTrack, everything is in one place. You gain in efficiency, clarity, and the ability to respond to unforeseen events.
A dashboard adapted to your business objectives
WelcomeTrack lets you customize your dashboard according to your business priorities. Key features include
Visualize key indicators: track delivery times, shipment volumes and returns rates in real time.
Data segmentation: analyze your performance by carrier, service type or warehouse.
Built-in alerts: set up notifications to be immediately informed of anomalies.
A concrete example: a company noticing a high rate of refused parcels for a specific carrier can quickly adjust its contracts or reinforce quality controls.
Rich data for in-depth analyses
With over 100 KPIs available, WelcomeTrack provides you with a wealth of data to help you understand every stage of your supply chain:
- Quality of service (QS): on-time delivery, traced parcel rate, damage.
- Operations volumes: number of orders shipped, delivered or returned.
- Carrier performance: compare lead times and success rates between your different service providers.
This data is accessible via a clear, intuitive interface, suitable for all skill levels.

Visualizations to facilitate decision-making
WelcomeTrack’s interactive graphs and maps make data easy to read and highlight critical points:
- Heat maps to quickly identify problem areas.
- Trend charts to track performance over a given period.
- Carrier comparators to assess the reliability of your logistics partners.
Direct benefit: a better understanding of overall performance reduces costs and improves efficiency.
Closer collaboration between your teams
Data centralization doesn’t just benefit logistics managers:
- Customer service: access up-to-date information to respond faster to customer requests.
- Management: present clear, concise dashboards at strategy meetings.
- Field teams: prioritize your actions with automated alerts and recommendations.
A measurable reduction costs and deadlines
The results speak for themselves:
- Reduced anomalies thanks to consolidated analysis.
- Faster decision-making, with fewer interruptions in the supply chain.
- Reduced costs linked to delays or errors thanks to targeted interventions.
Centralize, analyze, optimize
With WelcomeTrack, centralizing your indicators becomes a key lever for controlling your logistics performance. Discover how centralized management can transform your operations and enhance your customers’ experience.
Find out more about measuring the quality of your logistics operations
Track your post-purchase operations in real time
Anticipate logistical problems and bottlenecks with real-time tracking. WelcomeTrack helps you optimize every stage of the post-purchase e-commerce process.
Customize your logistics tracking reports
Get customized logistics reports with WelcomeTrack. Easily analyze your data and regain control of your performance